


Introduction
The presence of bugs in softwares and cloud architectures is “almost” inevitable in their development and operations. Although microservices have revolutionised the way we build and deploy applications through scalability and flexibility, the distributed nature of the system could make debugging challenging and tedious. Unlike monoliths, they require rooting out logs, tracing requests across multiple services, understanding and figuring out the complex connections and relationships between different parts of a system.
In this article, we will discuss the difference between debugging monoliths and microservices and also discuss the most effective ways to debug and troubleshoot microservices effectively. In addition, great tools for microservice debugging are also added to the article for developers and companies to get started easily.
Microservices Architecture Vs. Monolithic Architecture
A major problem microservices were created to solve was deployment and scalability. Monoliths were built as a single, tightly integrated unit and as a result, scaling, development and management typically involved replicating the entire application, even if only specific features require additional resources. This is because they are built with a single programming language and use a consistent set of libraries and framework for their operations.
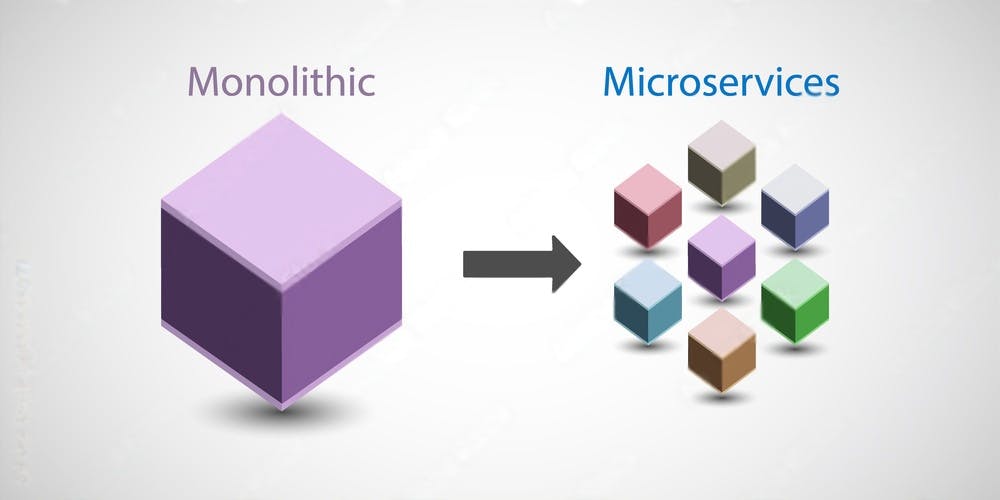
On the other hand, microservices were designed to address all these challenges with their modular architecture. Applications built on microservices are composed of independent and loosely-coupled services for developers to manage them at a more granular level. This helps to focus on individual services where issues might be present rather than replicating the entire application. They also offer the advantage of efficient resource utilisation and cost-effective scaling.
Debugging Monoliths vs Debugging Microservices
Debugging in microservices presents a distinct set of challenges compared to debugging in monoliths. Most of these problems originate from the distributed and modular characteristics of microservices architecture. Monoliths have a unified code-base system which makes debugging relatively straightforward and easy to trace. Also, developers can employ traditional debugging tools and techniques to identify problems, as the execution flow is contained within a single process.

Conversely, microservices are decentralised and frequently operate autonomously. As a result, debugging an issue might involve tracking the sequence of requests across various services. It necessitates the implementation of advanced monitoring tools, distributed tracing, and log centralization to easily perform debugging processes.
Read also: Microservice Architecture in SaaS
How to Debug Microservices Effectively
To effectively debug microservices without stress, here are a few steps to take;
Embrace the Observability Framework
The observability framework is a set of practices and principles that helps to deeply understand the internal state and behaviour of microservices. These services are but not limited to: instrumenting your services to actively collect data on performance and health, collecting and storing data efficiently to debug microservices and finally, making data accessible and searchable.
All these put together help developers discover the underlying issues and also help create an easy debugging experience. In addition, implementing the three pillars of observability – logs, metrics and traces – in a cohesive monitoring system can also strengthen control on microservices architecture.
Centralise the Logging System

Each microservice might run on separate machines, containers, or even different serverless environments consisting of decentralised distribution of log data. The distribution poses several challenges like slower debugging process, fragmented view of log data and monitoring challenges. Conversely, centralising the microservice logging system entails gathering and combining log data from every microservice into a single, unified platform for analysis, storage, and visualisation. With this, it does not only become easier to debug, but also easier to identify trends and patterns, improve security monitoring and troubleshoot faster.
Create a Logging Pattern
Establishing a consistent and structured approach to logging across a microservice architecture is another process that could help debug your microservices effectively. It is beyond simply defining a specific log format (e.g., JSON) and rather encompasses a broader approach. This approach includes defining a set of guidelines, conventions, and practices for generating log messages in a standardised manner. Log aggregation, collection and inclusion of correlation IDs with respect to context amongst others are some of the practices involved in creating a logging pattern. At the end, it becomes easier to search,identify problems faster and have a holistic view of your architecture's behaviour.
Incorporate Distributed Tracing into the Architecture
Microservice architecture is filled with a complex web of interactions in which data flows across multiple services, databases, and APIs. As a result, tracking could be a difficult process. Distributed tracing acts as the architecture’s “GPS” or “detective” tracking data flow across your entire system pinpointing where information goes, how long it takes, and where potential bottlenecks or errors reside. Tools like Zipkin and OpenTelemetry give insight on the detailed operations ongoing in the architecture efficiently and effortlessly.
Utilise Request IDs
In addition to distributed tracing, assigning a unique identifier to each incoming user request helps developers in correlating logs and analysing performances easily. The identifier works across the various microservices involved in processing that request. Developers can understand how the request progressed, where it encountered issues, and how different services interacted with it by simply searching for the same request across the microservice logs.
Leverage Debugging Tools
Special softwares and tools have been developed to assist developers and operators in identifying, analysing, and resolving issues within a microservices architecture. These tools provide features that facilitate debugging, performance monitoring, and overall system observability for effective and efficient debugging. Some of these tools are discussed in the following subtopic.
Tools used for Debugging and Troubleshooting Microservices.

Debuggers
Traditional debuggers remain valuable for inspecting variables, setting breakpoints, and stepping through code execution within individual microservices. Some of these debuggers are:
GDB
LLDB
DTrace (Dynamic tracing for various languages)
Valgrind (Memory debugging and profiling tool [C/C++])
Distributed Tracing Tools
These tracing tools visualise request flow across your microservices, helping developers to identify bottlenecks, errors, and service interactions contributing to an issue. They include:
Jaeger
Zipkin
OpenTelemetry
Prometheus Tempo
Profiling Tools
Profiling tools provide performance insights within each microservice, pinpointing resource bottlenecks or slow code sections. The difference between profiling tools and distributed tracing tools is their focus and actions. While the first analyses the performance of individual microservices and optimises each microservice within your architecture, the latter visualises the flow of requests across the entire microservices architecture and understands how requests propagate between services. Example of profiling tools include:
JProfiler
YourKit
Logging and Monitoring Tools
Logging and monitoring tools provide centralised access to microservices logs and allows log entry filtering, searching, and analysing for easy identification and tracing of error patterns and issues. Examples of such tools include:
ELK Stack
DataDog
Loki (Promtail + Grafana [logging and analysis])
Conclusion
While microservices offer numerous advantages, their distributed nature presents unique debugging challenges which –over the years– have sparked the development of innovative tools and techniques. Therefore, effective microservice operations start with proper planning to navigate the complexities of the architecture. The right infrastructures and tools are also of great importance as it helps reduce the stress and pain developers and companies might face as a result of debugging issues. Finally, investing and engaging in training, seminars and other upskilling events can help gain knowledge on effective microservice management and maintenance.